QurvE is an open-source, R-based software that provides a fully automated pipeline for fitting time-resolved biological data, including curve fitting, statistical evaluation, model selection, dose-response analysis, and built-in functions for data visualization. Click here to open the QurvE Homepage.
Web application
Visit the QurvE online application
QurvE application
Download the Windows set-up
User manual for QurvE application
QurvE R-package
R-package website
User manual for growth curve analysis
‘QurvE’ comes in the form of an R package that can be used to create custom
workflows and application-specific downstream analyses and is published in the
Comprehensive R Archive Network (CRAN) and on GitHub. Alternatively, an
intuitive graphical user interface (GUI) implemented as a shiny application for
non-programmers is available. The app can be installed locally on Windows
computers.
Click here for a bigger version of the figure.
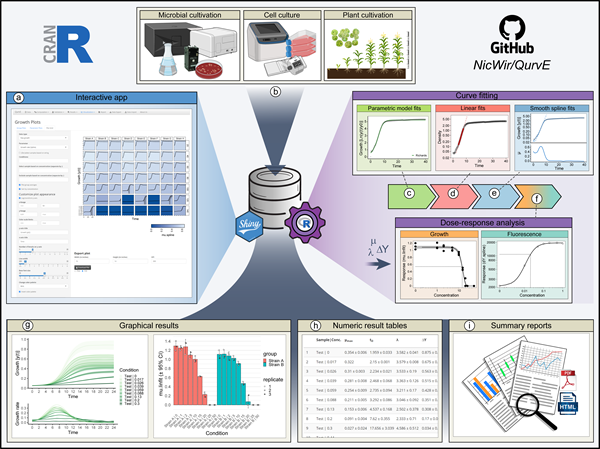
Figure: QurvE enables robust, high-throughput analysis of growth and fluorescence data. (a) All functionalities within QurvE are accessible via an intuitive graphical user interface created
with shiny, which can be installed locally on Windows PCs. (b) Any type of biological growth data can be analyzed. For commonly used cultivation devices, a growing list of data parser functions
allows the conversion of exported experimental data into the QurvE-compatible format. In a single computation workflow, three different types of algorithms are performed on every sample
in a dataset: (c) Five parametric models are fit to the data to find an equation that best describes the growth curve. (d) Relevant (log-) linear phases are extracted from each sample to perform
robust linear regression. (e) The representation of data points with cubic smoothing splines allows extraction of growth rates over time and applies to any curve shape. (f) Relevant parame
ters (growth rates, biomass yields, rate of fluorescence increase, etc.) can be used in combination with concentration data to analyze dose-response relationships. This is done by applying
either dose-response models or smoothing splines. (g) Dedicated plot functions facilitate the fit validation, the interpretation of results, and, due to the availability of numerous customization
options, the generation of suitable for publication. (h) All computed parameters can be exported as table files or inspected interactively from within the app. (i) All chosen fitting options as well as
numerical and graphical results can be compiled in reports in PDF and HTML format to promote data transparency and good scientific practice. In this spirit, raw data and results can be exported
as a single data container in the form of an .RData file to give other researchers access to data and analysis methods used.
Reference: Wirth, N.T., Funk, J., Donati, S. et al. QurvE: user-friendly software for the analysis of biological growth and fluorescence data. Nat Protoc (2023).