Researchers from the The Novo Nordisk Foundation Center for Biosustainability have discovered that different E. coli strains, often thought to be very similar, actually differ in their ability to produce certain chemicals. The results uncover which bacterial work horse is the best choice for the production of 40 commercially interesting molecules.
E. coli BL21 or E. coli K-12? Potato, Potato you might say. But new findings show that E.coli is not just E.coli, both when it comes to expression of proteins, and chemical production.
Today, bacterial cell factories are utilized to produce sought after chemicals for plastic products, cosmetics, food ingredients, and medicine. But often, the bio-refinery producing the chemical relies on an offhand selection of bacterial host, simply because very little data is available comparing the production potential of a widely used strain. Until now.
A road map for production of 40 chemicals
First the researchers sequenced the DNA of seven widely used strains of E. coli called BL21, C, Crooks, DH5a, MG1655, W3110, and W. Furthermore, the researchers looked at the cells’ performance (phenotype) and what genes where transcribed by looking at the “middle man” when going from DNA to protein: RNA.
Using these data, the scientists created a heat map displaying the production potential for 40 chemicals growing either with or without oxygen. Each point in the heat map was thus created by comparing the gene expression in each step towards the desired product.
"Some strains are remarkably better at producing certain chemicals than others"
Project Leader Adam Feist from The Novo Nordisk Foundation Center for Biosustainability at UCSD
Using a factory as an analogy, the researchers evaluated what workstations in a factory were available and how well the worker at every workstation performed.
Big differences between strains
The results showed that the cells’ metabolic physiology and gene expression varied widely, which impacted productivity, product yield, and titer for different molecules and chemicals.
“This heat map quite clearly shows that some strains are remarkably better at producing certain chemicals than others,” says corresponding author and Project Leader Adam Feist from The Novo Nordisk Foundation Center for Biosustainability’s international section “Network Reconstructions and in Silico Biology” at University of California San Diego.
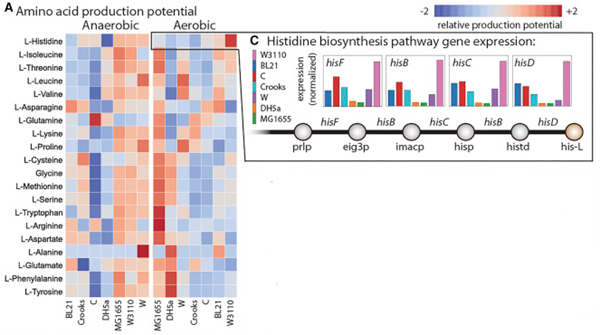
For instance, the heat map is very “lit up” when looking at E. coli W3110’s production potential for histidine when oxygen is available. The underlying data shows that the expression levels of the final five reactions towards histidine where quite high in W3110 compared to the levels of the six other strains under the same conditions. Hence, W3110 (pink in figure) is particularly well suited to produce histidine.
A similar example could be seen on another heat map, demonstrating the production potential of 2-phenylethanol, which is a substance with a nice rose-like odor commonly used in flavors and perfume.
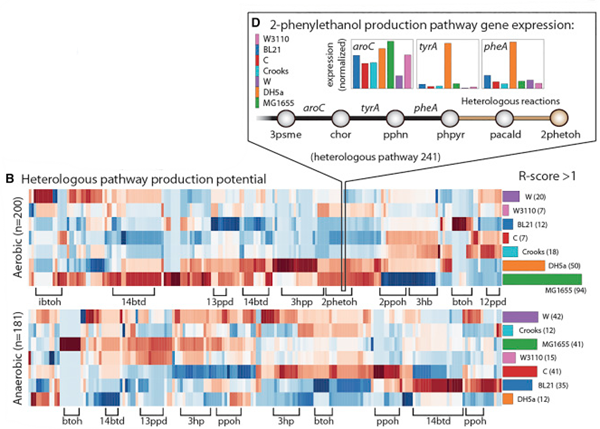
In this map, the last three steps were highly expressed in E. coli DH5a, hence making this strain an excellent choice for production of 2-phenylethanol.
“These heat maps can be an important tool in bio-refineries, where you need as efficient a production as possible. Now the bio-refiners can pick and choose the best starting hosts depending on the product – something they didn’t have the ability to do before this study,” says Adam Feist.
The research has been published in Cell Systems.